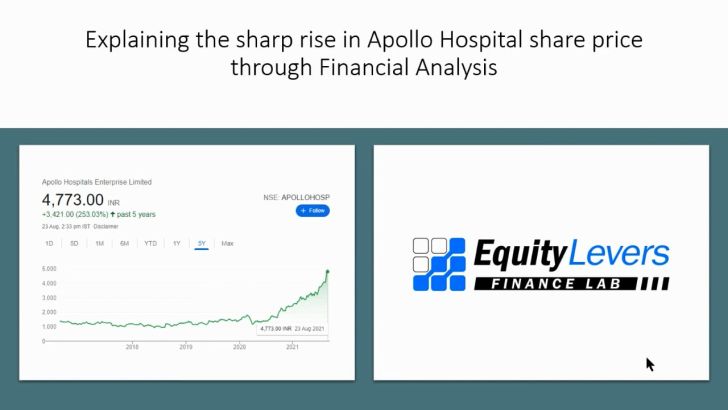
We are pleased to add a new product to our finance simulations product - A learning friendly Finance Lab. The lab is a full fledged financial terminal which spotlights valuation multiples. The best way to learn valuation is to examine historic valuation multiples commanded by the company relative to its past prevailing growth rates.
How does this help? The finance Lab makes it easy to use in class session to demonstrate important points. Kindly watch a video analysis of Apollo Hospital using Finance Lab as we demonstrate that this company continued to generate sales and ebitda but not PAT due to large capex and debt. Once that was completed, the share price has risen sharply. Each student can be asked to demonstrate for a new company the price, valuation and growth movements using this data. His/her learning will be strong.
Details of useful data
Data Type 1 - Company Valuation Multiples
Here is the table below our Finance Lab for Maruti Suzuki for the last 10 years. It shows PAT growth, ROE and P/E ratios for past 10 years. All in easy to access one page.
From the above data, it is easy to observe the below points:
In strong growth years (note the forward period growth), P/E and P/B rose in line with growth. Period from FY2013-17 has been very strong for Maruti and its P/E has gradually moved up from 21X to 34X. You can observe that the market price of Maruti moved up sharply from about Rs. 1,500 to Rs. 8,778. This increase was contributed both by EPS and P/E multiple expansions.
In the de-growth years starting FY2018-21 (the company also reported low & falling ROE), initially the P/E dropped to 25 and has then risen to 40 times now. This sharp P/E rise despite fall in earnings is due to a mathematical quirk. Maruti’s profits and EPS has declined as car sales have been significantly affected due to Covid since Mar-2020. Market perhaps feels that Maruti’s profits will rebound sharply and hence price has not fallen. Note that P/B has declined since 2018. Based on the above data, it can be seen that market valuation for Maruti seems expensive, unless we get better evidence of growth coming back.
Judging forward valuation using historic valuation benchmarks is easier. For example, the past valuation data indicates forward P/E multiple between 20X – 35X as a possible fair forward valuation range for the company.
Data Type 2 - Industry Valuation Multiples
The chart shows PE multiples for personal care industry for every quarter. Similar data is available PB, Market Cap, EV/ Ebitda, PEG and PS etc. This data is very useful to demonstrate industry valuations. For example, this shows Dabur, HUL, Godrej, PE multiple have expanded. While, Bajaj Consumer, Gillette PE ratios have declined corresponding to their fall in PAT growth.
Note: Valuation multiples are computed on each past result dates for each company
Links:
Thanks for reading.


