How Analysts Make Investment Decisions
Learn to profit from the earnings data pattern - Globus Spirits
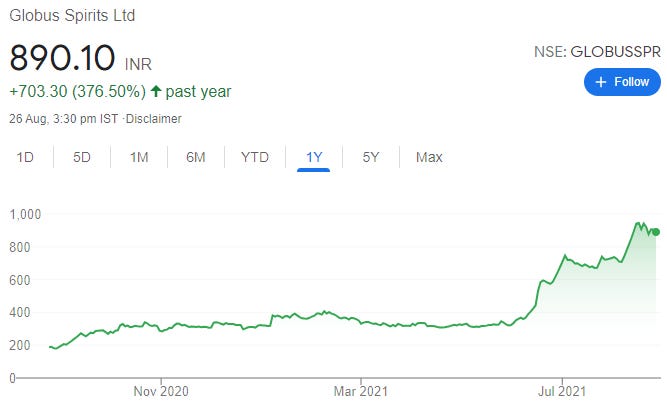
The following chart shows the share price of Globus Spirits. The company has give an almost 9X return over past 1 year. Learning how to spot such companies prior to their big run up will be rewarding.
This blog will show anyone could have invested when Globus Spirits share price was just around Rs 300 -400. We bought the share at Rs 325 and the best thing is that, we found the idea mainly by looking at past financial data. From this price, it has given almost 3X return for us. This earnings based data pattern has been very successful for us. More on this successful market data pattern trend in the next blog.
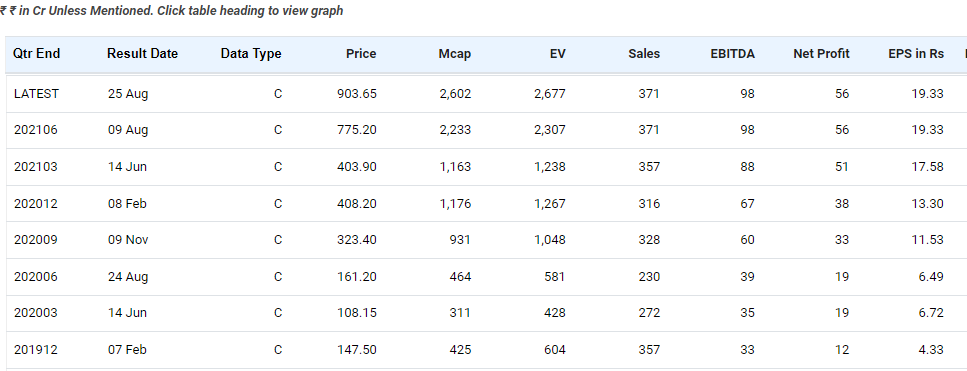
The chart below shows the P&L Account for the company:
We can note that:
the period from 9 November 2020 to 14 June 2021, the stock traded around Rs 300- 400.
there was a sharp jump in quarterly EPS starting from 24th August 2021.
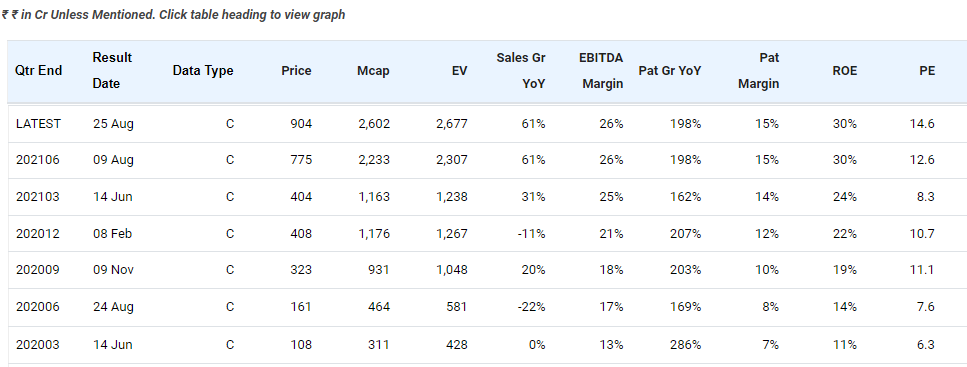
Lets look at historic valuation chart for the company:
Source of Data for historic result date PE multiples : The Finance Lab at www.equitylevers.com
From this chart we can observe that:
Growth and PAT and EBITDA margins expanded dramatically since Nov 9, 2020
ROE has almost doubled since last year
PE ratio between Nov 9, 2020 and June 14, 2021 remained very attractive at around 10. For a high growth and high profit margin company.
Starting Jan / March 2021, enough industry and company information was available that suggested that ethanol policy and general revival in distillery industry has benefitted this company. Just a google search would have been enough.
Finally how to value the company
We can see that growth in PAT is strong.
We know that the companies with PEG (Price Earnings Growth) of 1 or below are considered to be good to invest and this company is quoting below 0.3 PEG. Attractive.
We can easily calculate 1 year forward PAT (in say March 2021 for 1 year forward ended March 2022) for the company at Rs 150 -200 cr. (more on this in our e book). This means Forward PE of just 5-6. This in very attractive.
If the growth continues, even the PE could expand going forward.
If we compare with companies in similar size, we will find very few companies producing PAT of Rs 200 cr and still available at attractive Rs 2600 cr market cap.
Interested in learning this approach to investing?
Investors need to develop a strong common sense to judge business trends and build essential finance analysis skills that help identify market patterns that work. Once the basics are understood, financial and economic patterns that work can be learnt by anyone interested investor by regular observation and practice.
We explain the steps and the process of thinking and acting like seasoned investors in our free e book in the following 4-step process.
Analysis of past financial data for the company
Making estimates of future growth and margins for the company
Finding and assessing the economic reasons (equity levers) that are playing out for company or sector
Making an assessment of valuation multiple, the company may command next year. We demonstrate that this step can be implemented by anyone by observing how markets valued the company on past result dates.
Click to access the Free E Book
We offer numerous real investment games, and practice projects for developing financial analysis and investing skills. These are available at our Finance Lab.
A detailed Pictorial of our finance lab is available here
Watch a demo video of how you can easily analyze Acrysil Ltd, a listed quartz sink manufacturer with our Finance Lab
News Press about us
For Institutional subscriptions : Kindly contact at founder@equitylevers.com
Best wishes from EquityLevers Team
Follow us on Twitter, LinkedIn & YouTube as we share more interesting investing content!


